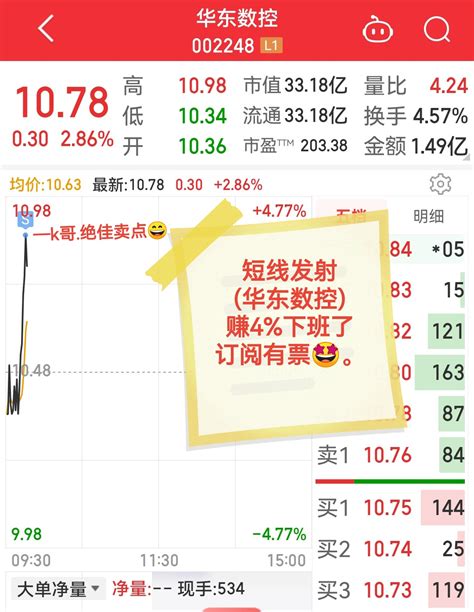
Understanding Daily Stock Trading Information
Investing in the stock market involves understanding various aspects of trading, including daily buy and sell activities. Here, we'll delve into what daily buy and sell information entails and how investors can interpret and utilize it effectively.
1. Daily Trading Volume:

Definition:
Daily trading volume refers to the total number of shares traded within a single trading day.
Significance:
High trading volume may indicate increased investor interest or significant market activity, potentially signaling price movements. Conversely, low volume may suggest decreased interest or stability.
Interpretation:
Investors monitor volume trends to gauge market sentiment and liquidity. A spike in volume accompanying price changes could confirm the strength of a trend.
2. Bid and Ask Prices:
Bid Price:
The highest price a buyer is willing to pay for a stock.
Ask Price:
The lowest price a seller is willing to accept for a stock.
BidAsk Spread:
The difference between the highest bid price and the lowest ask price.
Significance:
The bidask spread reflects market liquidity and trading activity. Narrow spreads indicate high liquidity, while wide spreads may suggest low liquidity or volatility.
Interpretation:
Investors assess bid and ask prices to determine optimal entry and exit points. Tight spreads facilitate efficient trading, while wide spreads may incur higher transaction costs.
3. Market Orders vs. Limit Orders:
Market Orders:
Orders executed at the current market price, guaranteeing execution but not price.
Limit Orders:
Orders set at a specific price or better, ensuring price control but not execution certainty.
Significance:
Market orders prioritize execution speed, while limit orders offer price precision.
Interpretation:
Investors choose between market and limit orders based on their trading objectives, risk tolerance, and market conditions. Market orders suit immediate execution needs, while limit orders allow for price negotiation.
4. Time and Sales Data:
Definition:
Time and sales data provide a realtime record of executed trades, including trade price, volume, and timestamp.
Significance:
Time and sales data offer transparency into individual trade details, enabling traders to analyze transaction patterns and market dynamics.
Interpretation:
Investors use time and sales data to identify trade opportunities, detect market trends, and assess trade execution quality.
5. Candlestick Patterns:
Definition:
Candlestick charts depict price movements within a specific timeframe, typically showing open, high, low, and close prices as "candlesticks."
Significance:
Candlestick patterns reveal market sentiment and potential price reversals or continuations.
Interpretation:
Investors analyze candlestick patterns to make informed trading decisions. Patterns like engulfing, hammer, and doji signal bullish or bearish market conditions, guiding entry and exit strategies.
Conclusion:
Understanding daily buy and sell information is essential for investors navigating the stock market. By interpreting trading volume, bidask prices, order types, time and sales data, and candlestick patterns, investors can make informed decisions, manage risks, and capitalize on market opportunities effectively. Staying abreast of daily trading activities empowers investors to navigate market fluctuations and achieve their financial goals.
